2. Define your investment goals
3. Build your investment strategy
🕑 3m | |
5.2 Benchmarking your progress | 🕑 2m |
🕑 1m | |
🕑 3m | |
4 q's |
Benchmarking happens across all facets of life. Grab a coffee from a new coffee shop and immediately you’ll compare it to your previous café. Benchmarking is all about comparison.
Benchmarking is important because it gives you a guide to relative performance.
An index is a measure used to track the performance of all or part of the market. There are different indices for almost every industry sector and asset class across the world. For example, the S&P/ASX200 tracks the performance of the largest 200 companies on the Aussie market while the S&P 500 measures the performance of 500 large companies listed in the US.
For example.
Let’s say your portfolio returned 7.0% one year but the average return of the S&P/ASX200 was 9.5%. You’d probably feel that your portfolio hadn’t performed as well as it could have.
On the other hand, imagine if your portfolio returned -2% over the course of the year. On the surface, that’s not a great result. It’s not too bad, however, if the average return of the S&P/ASX200 was -6.5%.
Benchmarking not only lets you compare relative performance but also lets you compare over time. This can then help inform your future investment decisions.
Ultimately, benchmarking is the best way for you to compare your portfolio’s performance. This in turn will inform your decisions around:
There are a number of different ways, but essentially, any benchmarking that helps you get an insight into the comparative performance of your own investment is the aim.
For example.
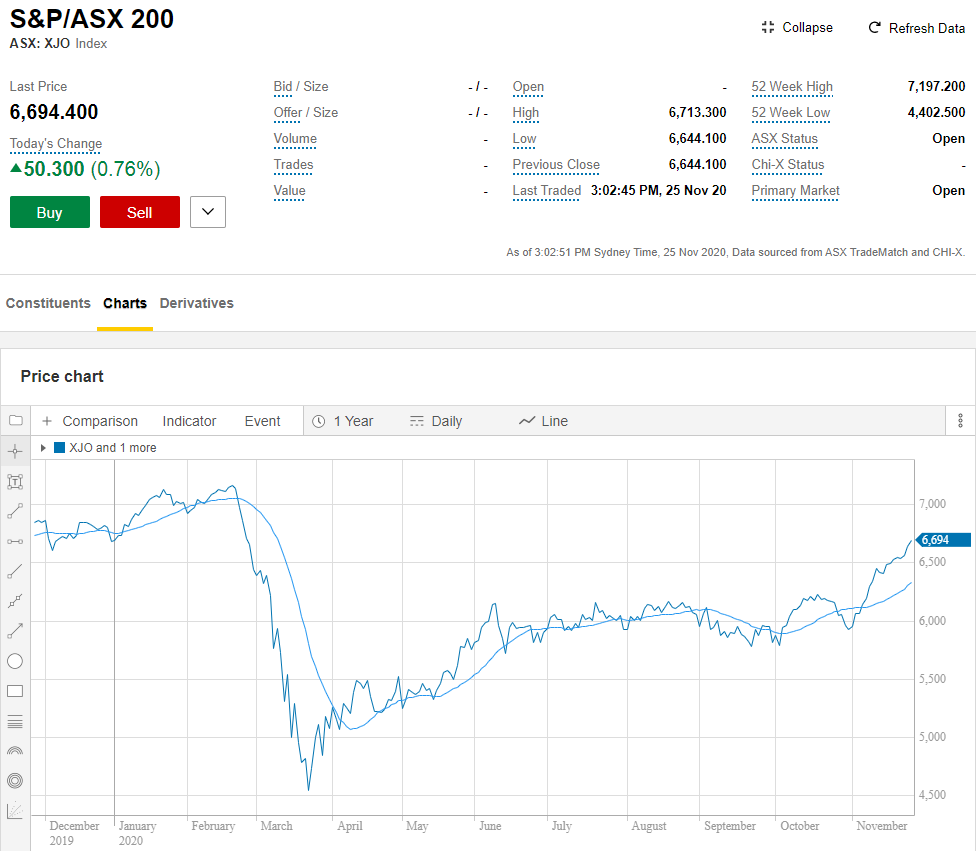
If you invest mostly in Australian companies, you could compare the performance of your overall portfolio with the performance of the S&P/ASX200 over the same period. You can easily adjust the timeframe to suit what you’re comparing. To view your portfolio performance, log in to your CommSec account and go to “Portfolio”, then look at the number next to “Total profit/loss”. To view the performance of the ASX200, click on “XJO” at the very top of the page (XJO is the code for this index) and then select “Charts”.

Chart showing performance of the S&P/ASX 200 for the past five years.
If you’ve invested in international companies or ETFs that give you exposure to overseas markets, you could use an international index to benchmark against your portfolio. For example, the S&P 500 or the MSCI , which are broad global indices.
These are macro benchmarks but you could also go micro. For example, you could compare your investment performance to specific sectors on the ASX. This way you can learn which market sectors have performed the best over a given period of time (see chart below) and which have not performed so well.

Next Topic: 5.3 Rebalancing
Disclaimer
CommSec Learn is intended to provide general information of an educational nature only. You can view the product Terms and Conditions, Product Disclosure Statement, Best Execution Statement, Financial Services Guide and should consider them before making any decision about these products and services. Any securities or prices used in the examples given are for illustrative purposes only and should not be considered as a recommendation to buy, sell or hold. Past performance is not indicative of future performance.